How and why I hacked my PDU

Chapter 1 - Why?
After expanding my rack from 2U to 12U, I needed a simple solution that would allow me to remotely switch off outlets, monitor my consumption, and integrate it into Grafana. After a few minutes of research, I stumbled upon the "Intertech SW-0816" PDU. The quality/function/price ratio seemed perfect, so I decided to purchase it.
A week later, I received it and began testing. Everything worked as I imagined except, unfortunately, SNMP was not enabled, and I couldn't link it to my Prometheus... This is why I thought the simplest solution would be to hack it. Looking at the interface, it seemed likely possible.
Chapter 2 - How?
Once logged in with the admin account of the PDU, I saw that all the data were displayed on the web page, so I had two options:
- The first: write a script that makes a GET request with basic auth, retrieves the page, and extracts the data.
- The second: Find a vulnerability and see how the data is sent to WEB clients.
I chose the second option because it seemed more fun, simple, and faster than the first.
And I'm "sorry" to say that it was ridiculously easy to steal the data. By pressing F12 on my browser, then going to the "Network" tab, I saw that the application made 1 request per second to the URL "http://

I ended up processing this information: Temperature, Amperage, Humidity, and a boolean on/off for the 8 outlets.
Chapter 3 - Implementation
After finding a data source, I started to exploit it. I armed myself with my WebStorm IDE and began a NodeJS application, which is kind of my go-to language. It's worth noting that I'm not a developer by any means, but that doesn't stop me from learning this language.
I started by making a request to the status.xml URL, retrieving the data, installing a prometheus-client module, and then creating all the fields I wanted to export. A very simple app that links the PDU data to a Prometheus server.
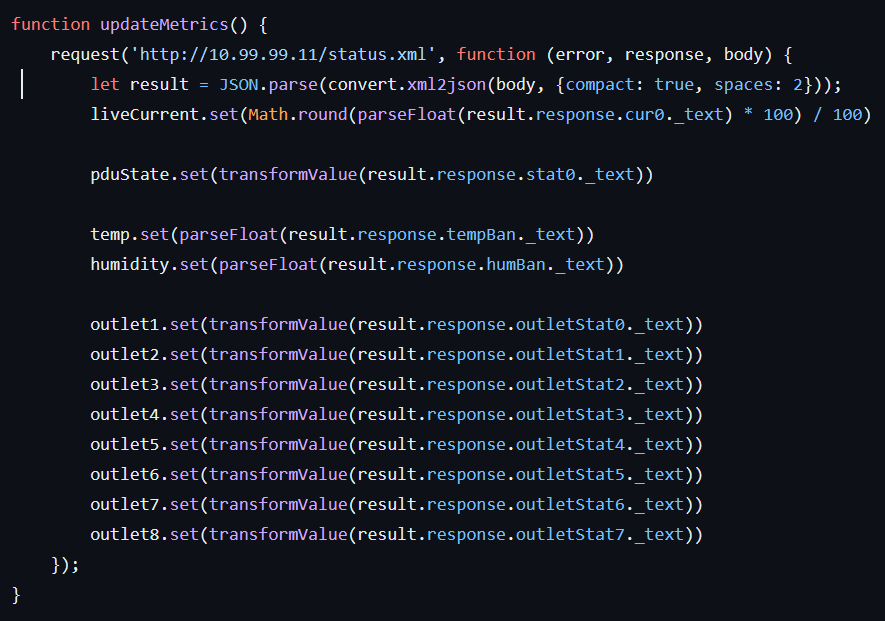
Once the data was on the Prometheus server, all that was left was to link this data to a panel. So, I created a simple panel with the graphs and data I wanted.
And that's it, the setup is complete, and now it's time to show the result!
Chapter 3 - Result
As you can see below, the result is, in my opinion, perfect.
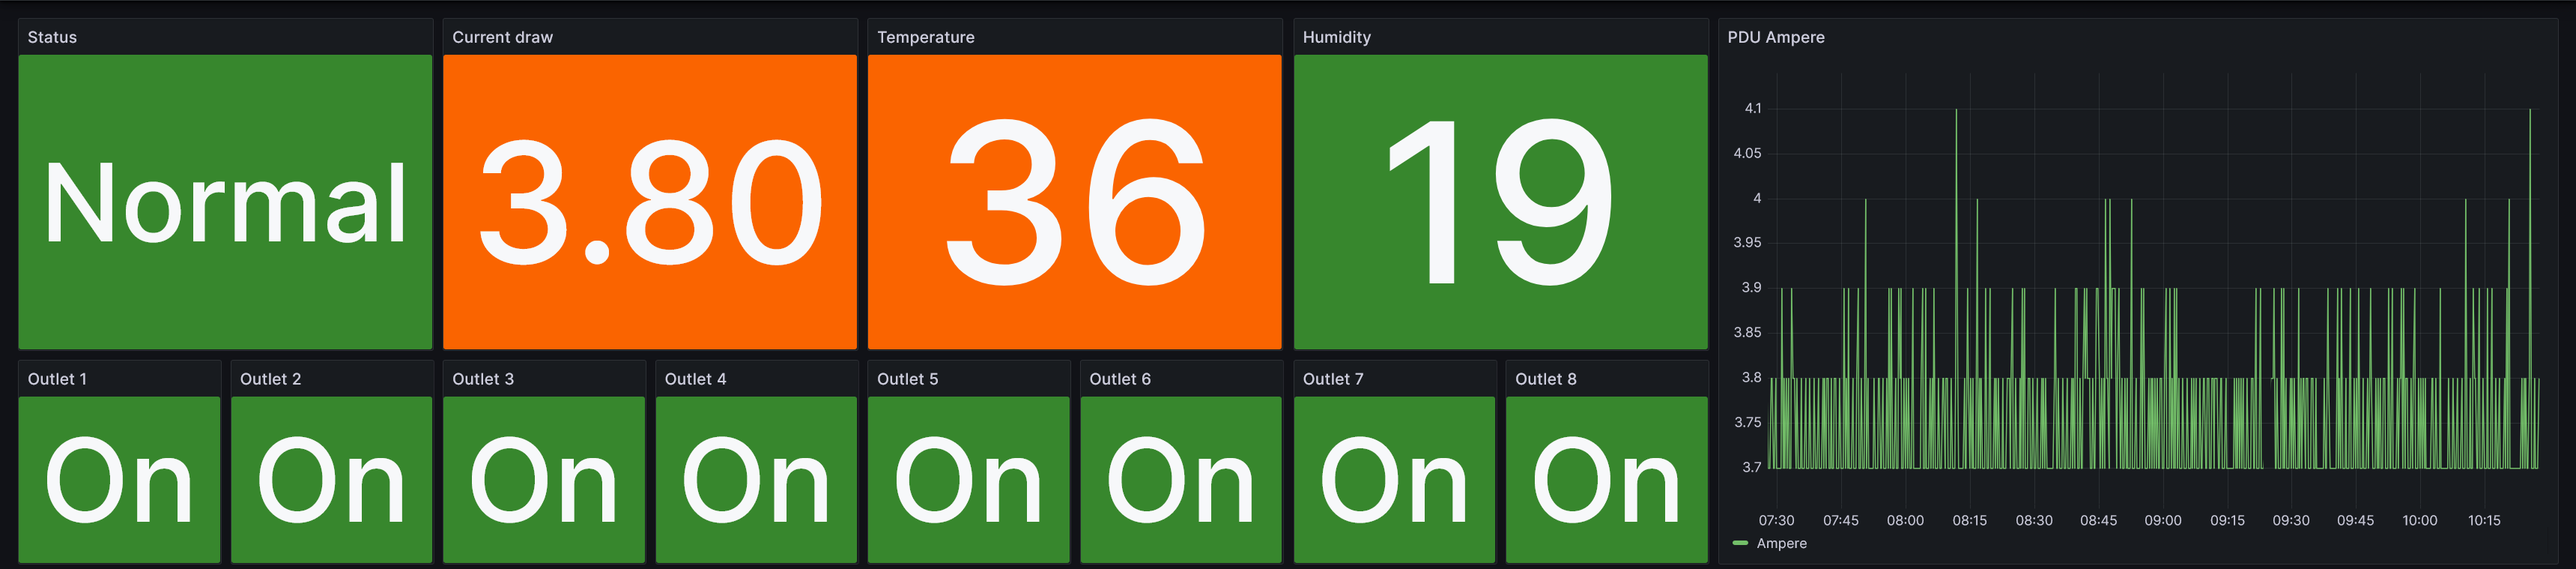
This now allows me to have a consumption history as well as the real-time state of my electrical circuit!
To allow everyone to use the script and my findings, you'll find all the code and Grafana panel on my GitHub below!
GitHub Link